Next: Dispersion GUI mode - Up: The relaxation dispersion auto-analysis Previous: Dispersion GUI mode - Contents Index
To view the results of the analysis, the relax results window will have been automatically opened. If it was closed, click on the “View→Results viewer” menu entry or the “Results viewer window” button in the toolbar to open the window. This window will list all of the *.out text files and *.agr 2D Grace plots created by the auto-analysis. By double clicking on the file, these can be opened. The operating specific text editor will be launched for the text files. For the Grace files, the installed Grace version (Xmgrace, QtGrace, or GraceGTK) will be launched.
Firstly, to see which models have been chosen for the spin systems and which have no statistically significant dispersion, find the model.out file and double click on it. You should see the following:
[basicstyle=\ttfamily \scriptsize,numbers=none]
# Parameter description:  The dispersion model.
#
# mol_name    res_num    res_name    spin_num    spin_name    value                        error
None          1          GLY         None        N            'NS CPMG 2-site expanded'    None
None          2          GLY         None        N            'No Rex'                     None
None          3          GLY         None        N            'No Rex'                     None
None          4          GLY         None        N            'No Rex'                     None
None          5          GLY         None        N            'CR72'                       None
None          6          GLY         None        N            'No Rex'                     None
None          7          GLY         None        N            'No Rex'                     None
None          8          GLY         None        N            'NS CPMG 2-site expanded'    None
None          9          GLY         None        N            None                         None
None          10         GLY         None        N            'No Rex'                     None
None          11         GLY         None        N            'No Rex'                     None
None          12         GLY         None        N            'NS CPMG 2-site expanded'    None
None          13         GLY         None        N            'No Rex'                     None
None          14         GLY         None        N            'CR72'                       None
None          15         GLY         None        N            'No Rex'                     None
None          16         GLY         None        N            'No Rex'                     None
None          17         GLY         None        N            'No Rex'                     None
None          18         GLY         None        N            'No Rex'                     None
None          19         GLY         None        N            'No Rex'                     None
None          20         GLY         None        N            'No Rex'                     None
None          21         GLY         None        N            'CR72'                       None
None          22         GLY         None        N            'No Rex'                     None
None          23         GLY         None        N            'CR72'                       None
None          24         GLY         None        N            'No Rex'                     None
None          25         GLY         None        N            'No Rex'                     None
None          26         GLY         None        N            'CR72'                       None
None          27         GLY         None        N            None                         None
None          28         GLY         None        N            None                         None
None          29         GLY         None        N            'No Rex'                     None
None          30         GLY         None        N            None                         None
None          31         GLY         None        N            'NS CPMG 2-site expanded'    None
None          32         GLY         None        N            'NS CPMG 2-site expanded'    None
None          33         GLY         None        N            'No Rex'                     None
None          34         GLY         None        N            'NS CPMG 2-site expanded'    None
None          35         GLY         None        N            'No Rex'                     None
None          36         GLY         None        N            'No Rex'                     None
None          37         GLY         None        N            'No Rex'                     None
None          38         GLY         None        N            'NS CPMG 2-site expanded'    None
None          39         GLY         None        N            'NS CPMG 2-site expanded'    None
None          40         GLY         None        N            'No Rex'                     None
None          41         GLY         None        N            'No Rex'                     None
None          42         GLY         None        N            'NS CPMG 2-site expanded'    None
None          43         GLY         None        N            'No Rex'                     None
None          44         GLY         None        N            'No Rex'                     None
None          45         GLY         None        N            'NS CPMG 2-site expanded'    None
None          46         GLY         None        N            'NS CPMG 2-site expanded'    None
None          47         GLY         None        N            'NS CPMG 2-site expanded'    None
None          48         GLY         None        N            'No Rex'                     None
None          49         GLY         None        N            'No Rex'                     None
None          50         GLY         None        N            'No Rex'                     None
None          51         GLY         None        N            'CR72'                       None
None          52         GLY         None        N            'NS CPMG 2-site expanded'    None
None          53         GLY         None        N            'NS CPMG 2-site expanded'    None
None          54         GLY         None        N            None                         None
None          55         GLY         None        N            'NS CPMG 2-site expanded'    None
None          56         GLY         None        N            'No Rex'                     None
None          57         GLY         None        N            'No Rex'                     None
None          58         GLY         None        N            'No Rex'                     None
None          59         GLY         None        N            'CR72'                       None
None          60         GLY         None        N            'No Rex'                     None
None          61         GLY         None        N            'NS CPMG 2-site expanded'    None
None          62         GLY         None        N            'NS CPMG 2-site expanded'    None
None          63         GLY         None        N            'CR72'                       None
None          64         GLY         None        N            'CR72'                       None
None          65         GLY         None        N            'CR72'                       None
None          66         GLY         None        N            'NS CPMG 2-site expanded'    None
None          67         GLY         None        N            'NS CPMG 2-site expanded'    None
None          68         GLY         None        N            None                         None
None          69         GLY         None        N            None                         None
None          70         GLY         None        N            'NS CPMG 2-site expanded'    None
None          71         GLY         None        N            'NS CPMG 2-site expanded'    None
None          72         GLY         None        N            'NS CPMG 2-site expanded'    None
None          73         GLY         None        N            'CR72'                       None
Excluding the deselected spin systems with the model `None' and those with no statistically significant dispersion, `No Rex', it can be seen that in some cased the `CR72' model is selected whereas in others the `NS CPMG 2-site expanded' model is selected. The differences between the `CR72' analytic model and the `NS CPMG 2-site expanded' numeric model are insignificant. To see this, open the CR72/chi2.out and NS CPMG 2-site expanded/chi2.out text files in the ∼/dispersion/log_non_clustered directory and compare the optimised chi-squared values (this can be performed with the mouse by using the pipe editor window, changing the current data pipe, and double clicking on the files in the results viewer window for each data pipe - see below for more details).
To see which spins have been assigned the model `No Rex' due to the R2eff/R1ρ insignificance level of 1.0 rad/s, search the log messages for `insignificance'. You should see:
[basicstyle=\ttfamily \tiny,language=relax_log,numbers=none]
relax> relax_disp.insignificance(level=1.0)
Deselecting spin ':2@N', the maximum dispersion curve difference for all curves is 0.772528040762 rad/s.
Deselecting spin ':3@N', the maximum dispersion curve difference for all curves is 0.572686080104 rad/s.
Deselecting spin ':4@N', the maximum dispersion curve difference for all curves is 0.20753288407 rad/s.
Deselecting spin ':7@N', the maximum dispersion curve difference for all curves is 0.184120905625 rad/s.
Deselecting spin ':10@N', the maximum dispersion curve difference for all curves is 0.746360942576 rad/s.
Deselecting spin ':11@N', the maximum dispersion curve difference for all curves is 0.372702361421 rad/s.
Deselecting spin ':13@N', the maximum dispersion curve difference for all curves is 0.261522940719 rad/s.
Deselecting spin ':15@N', the maximum dispersion curve difference for all curves is 0.743965404051 rad/s.
Deselecting spin ':16@N', the maximum dispersion curve difference for all curves is 0.198783344901 rad/s.
Deselecting spin ':17@N', the maximum dispersion curve difference for all curves is 0.469568638477 rad/s.
Deselecting spin ':18@N', the maximum dispersion curve difference for all curves is 0.720840385548 rad/s.
Deselecting spin ':19@N', the maximum dispersion curve difference for all curves is 0.290773963568 rad/s.
Deselecting spin ':20@N', the maximum dispersion curve difference for all curves is 0.983669594767 rad/s.
Deselecting spin ':22@N', the maximum dispersion curve difference for all curves is 0.507488886605 rad/s.
Deselecting spin ':24@N', the maximum dispersion curve difference for all curves is 0.984086643389 rad/s.
Deselecting spin ':25@N', the maximum dispersion curve difference for all curves is 0.638104572082 rad/s.
Deselecting spin ':29@N', the maximum dispersion curve difference for all curves is 0.525261970487 rad/s.
Deselecting spin ':33@N', the maximum dispersion curve difference for all curves is 0.822112754666 rad/s.
Deselecting spin ':35@N', the maximum dispersion curve difference for all curves is 0.713976877685 rad/s.
Deselecting spin ':36@N', the maximum dispersion curve difference for all curves is 0.413602640091 rad/s.
Deselecting spin ':37@N', the maximum dispersion curve difference for all curves is 0.302953864843 rad/s.
Deselecting spin ':40@N', the maximum dispersion curve difference for all curves is 0.401535026435 rad/s.
Deselecting spin ':41@N', the maximum dispersion curve difference for all curves is 0.805657060225 rad/s.
Deselecting spin ':43@N', the maximum dispersion curve difference for all curves is 0.582523964429 rad/s.
Deselecting spin ':44@N', the maximum dispersion curve difference for all curves is 0.325638582443 rad/s.
Deselecting spin ':45@N', the maximum dispersion curve difference for all curves is 0.947956877688 rad/s.
Deselecting spin ':49@N', the maximum dispersion curve difference for all curves is 0.872396631779 rad/s.
Deselecting spin ':50@N', the maximum dispersion curve difference for all curves is 0.403543891199 rad/s.
Deselecting spin ':56@N', the maximum dispersion curve difference for all curves is 0.468272490195 rad/s.
Deselecting spin ':57@N', the maximum dispersion curve difference for all curves is 0.634215047495 rad/s.
Deselecting spin ':58@N', the maximum dispersion curve difference for all curves is 0.953109267554 rad/s.
Search for `eliminate' to see which models have been removed due to the model elimination step (see section 11.9.9 on page ![[*]](crossref.png) for details).
For example for the CR72 model:
for details).
For example for the CR72 model:
[basicstyle=\ttfamily \tiny,language=relax_log,numbers=none]
relax> eliminate(function=None, args=None)
Data pipe 'CR72 - relax_disp (Mon Feb 17 18:00:16 2014)':  The pA parameter of 0.50003 is less than  0.50100, eliminating the spin cluster [':6@N'].
Data pipe 'CR72 - relax_disp (Mon Feb 17 18:00:16 2014)':  The pA parameter of 0.50001 is less than  0.50100, eliminating the spin cluster [':38@N'].
Data pipe 'CR72 - relax_disp (Mon Feb 17 18:00:16 2014)':  The pA parameter of 0.50001 is less than  0.50100, eliminating the spin cluster [':42@N'].
Data pipe 'CR72 - relax_disp (Mon Feb 17 18:00:16 2014)':  The pA parameter of 0.50001 is less than  0.50100, eliminating the spin cluster [':45@N'].
Data pipe 'CR72 - relax_disp (Mon Feb 17 18:00:16 2014)':  The pA parameter of 0.50000 is less than  0.50100, eliminating the spin cluster [':46@N'].
Data pipe 'CR72 - relax_disp (Mon Feb 17 18:00:16 2014)':  The pA parameter of 0.50002 is less than  0.50100, eliminating the spin cluster [':47@N'].
Data pipe 'CR72 - relax_disp (Mon Feb 17 18:00:16 2014)':  The pA parameter of 0.50000 is less than  0.50100, eliminating the spin cluster [':48@N'].
Data pipe 'CR72 - relax_disp (Mon Feb 17 18:00:16 2014)':  The pA parameter of 0.50002 is less than  0.50100, eliminating the spin cluster [':60@N'].
Data pipe 'CR72 - relax_disp (Mon Feb 17 18:00:16 2014)':  The pA parameter of 0.50000 is less than  0.50100, eliminating the spin cluster [':62@N'].
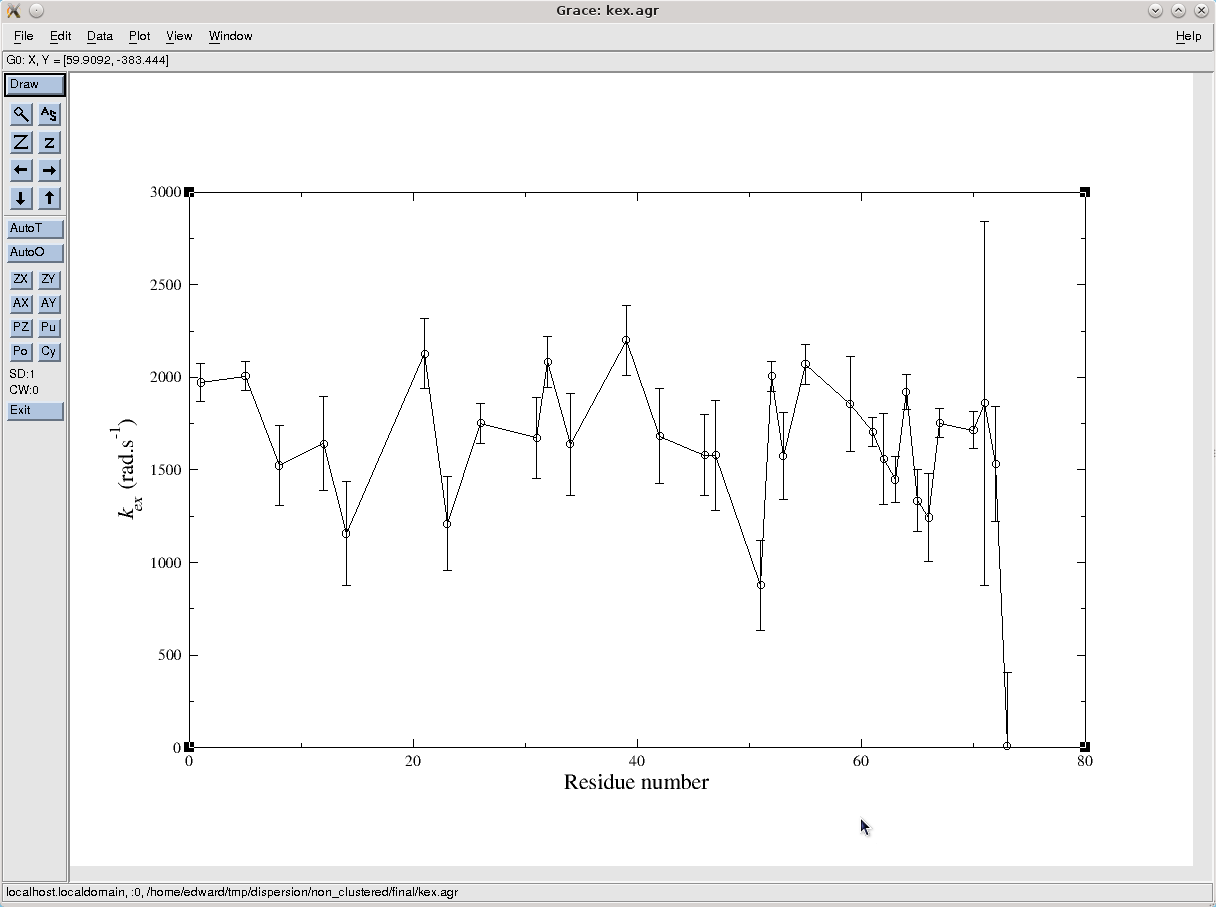
To see the optimised parameter values, double click on the kex.agr file to see the exchange rates. This will open the grace.view user function window by which the file can be opened. The default settings produces the following graph:
|
The exchange rate for most spins experiencing exchange is between 1000 and 2000 s-1. Opening the pA.agr file, it can be seen that the population of state A is approximately 0.98. A number of spins have much lower values than this, but their errors are huge meaning that all but 3 are statistically the same as 0.98 (note that a proper ANOVA statistics analysis would be required to make such statements).
To see one of the dispersion curves, open the disp_64_N.agr file in Grace. The default settings will produce the graph:
![\includegraphics[
width=\textwidth,
bb=14 14 788 523
]{graphics/screenshots/dispersion_analysis/disp_64_N}](img301.svg)
|
To improve the appearance of this plot, please refer to the Grace software documentation.